
Users are frustrated and report random errors that force them to re-enter their work. If you are the person who has to resolve their errors, where do you start with an error that is seemingly random and has little detail surrounding the context? One thing to look for is deadlock events.
What is a deadlock?
A deadlock occurs when two or more tasks permanently block each other by each task having a lock on a resource which the other tasks are trying to lock. For example:
-
Transaction A acquires a share lock on row 1.
-
Transaction B acquires a share lock on row 2.
-
Transaction A now requests an exclusive lock on row 2, and is blocked until transaction B finishes and releases the share lock it has on row 2.
-
Transaction B now requests an exclusive lock on row 1, and is blocked until transaction A finishes and releases the share lock it has on row 1.
Transaction A cannot complete until transaction B completes, but transaction B is blocked by transaction A. This condition is also called a cyclic dependency.

Fortunately, instead of allowing the transactions to be blocked forever; SQL server is smart enough to recognize the situation and kill one of the processes so that the other can continue.
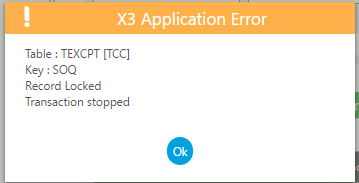
The effect is that a user who was chosen as the victim will likely see an error message. It may look similar to:
Am I experiencing deadlocks?
Previously, in SQL Server 2008, in order to capture a deadlock we had to create a server side/profiler trace or use trace flags 1204 and 1222. As of SQL Server 2012 a new feature was added which makes it incredibly simple to identify deadlocks within your environment.
There is an Extended Events session running by default called system_health that automatically captures deadlock events.
You can also review in our knowledgebase KB ID 84406 (How do I determine if a deadlock event occurred that originated from Sage X3?)
- Login to Microsoft SQL Server Management Studio (SSMS)
- Expand the Management folder
- Expand Extended Events
- Expand Sessions
- Expand system_health
Note: system_health is a default session that is always running - Double-click on package0.event_file
- Click on Filters and add a filter to find the xml_deadlock_report, for example
- Field = name
- Operator = Contains
- Value = deadlock
- Highlight the report in question
- Double-click the xml_report to review the xml content of the queries involved on the Details tab
You can also gather the system_health.xel files from the SQL Server log file location. Something similar to:

For a visual representation review the Deadlock tab
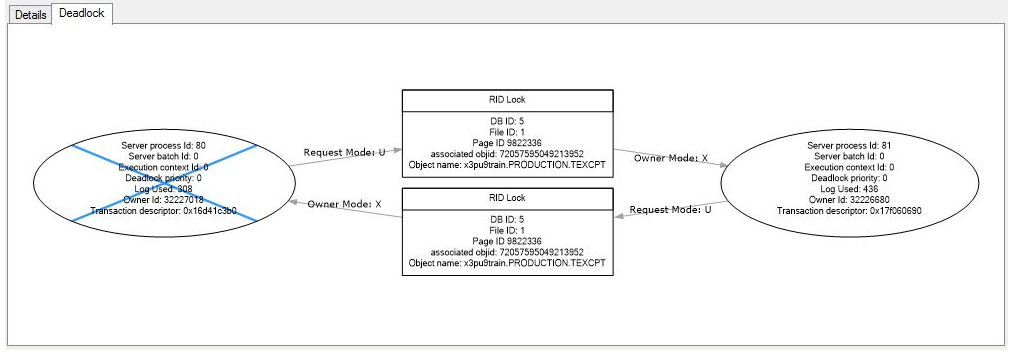
Note: The image is very similar to the deadlock image above.
What next?
This can be used as a valuable starting point for a SQL Server Database Administrator to troubleshoot. There are many potential causes and solutions. You will need to work with your SQL DBA to determine the best course of action.
As an example, you may need to review the queries reported in the xml_deadlock_report and review their query plans. If you can duplicate the issue, you likely want to run some Extended Events traces. You can review in the knowledgebase our KB ID 83828 (Microsoft's Extended Events and Sage X3)
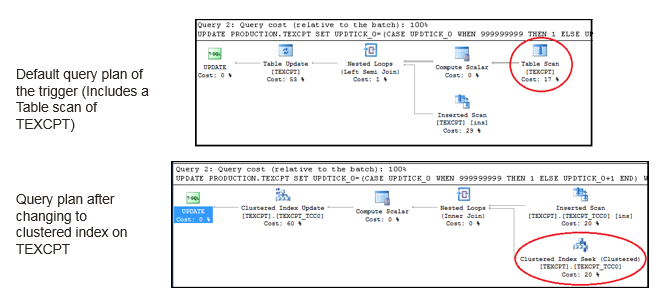
The resolution might be as simple as changing a non-clustered index to a clustered index. This is an example of the knowledgebase KB ID 84409.
It was determined using the deadlock event details that the query used a table scan. By changing the index, we changed the query plan thereby eliminating our deadlock potential.
As always, you may want to keep in mind other performance troubleshooting methods and review in the knowledgebase in KB ID 76348 (How to troubleshoot slow performance for Sage X3)